How Markets Actually Work
Lesson 2: How Markets Actually Work
Most of your market is not thinking about you right now.
This is not a problem to solve. It is a structural fact about how markets work — and understanding it changes how you allocate every euro in your budget, what you ask of your campaigns, and how you explain marketing to a board.
At any given moment, roughly 5% of your potential buyers are actively in-market. Thinking about buying in your category. Comparing options. Ready to be converted. The other 95% are not. They are living their lives, not shopping for what you sell. They might buy in six months. Or two years. Or the next time something in their situation changes. But not today.
This is the 95/5 rule, grounded in Byron Sharp's work at the Ehrenberg-Bass Institute and formalised by Dale Harrison. And its implications go far beyond the obvious: if you build your entire marketing strategy around the 5%, you will hit a ceiling and not understand why.
Where the 5% Comes From — The Calculation
The 5% is not an estimate. It is a mathematical consequence of purchase frequency — and the calculation is simple enough to run for any category.
Here is the worked example. I ran this for the plant-based meat market in Germany for Madre Brava.
In 2024, the plant-based meat category in Germany looked like this:
- Total German households: 41.8 million
- Category penetration: 32.2% — meaning 13.5 million households bought plant-based meat at least once that year
- Average purchase frequency among buyers (W): 8.4 times per year
- Average purchase interval: 52 weeks ÷ 8.4 purchases = every 6.2 weeks
Now: how many of those 13.5 million buying households are actually making a purchase in any given week?
[APPENDIX — 95/5 Calculator] Run this calculation for your own category. Interactive tool at
materials/95-5-calculator.html— enter your penetration, purchase frequency W (or contract cycle for B2B), and household or account count. The tool outputs your weekly in-market pool, your never-bought pool, and the CMO framing for the budget conversation. B2C and B2B modes both supported.
Active buyers per week = 13.5 million × (8.4 ÷ 52) = 13.5 million × 0.162 = ~2.18 million households
As a percentage of all 41.8 million German households: 2.18 million ÷ 41.8 million = 5.2%.
In any given week, approximately 5% of all German households are purchasing plant-based meat. The other 95% are not. They are not searching. They are not comparing. They are not reachable through performance advertising in any meaningful sense.
This is the mathematical basis of the 95/5 rule. It is not unique to plant-based meat. Run the same calculation for your category, with your penetration rate and your purchase frequency, and you will arrive at a similar number — because most FMCG categories sit in this range under normal market conditions.
The number gets more interesting when you look at the non-buyer pool. In Germany, 67.8% of households — approximately 27.5 million households — had never bought plant-based meat in 2024. And of those, 95% were aware of the category. Ninety-five percent awareness. Thirty-two percent buyer penetration. That is a 63-percentage-point awareness-action gap.
63% of German households know that plant-based meat exists. They have an impression of it. Some positive, some negative, many neutral. And they have not bought it. Not because they haven't heard of it — they have. But because the product has not yet entered their active consideration at the right moment, with the right framing, with enough positive mental association to overcome inertia.
This is the market that brand marketing is for. The 5% who are actively buying this week can be captured with performance advertising. The 27.5 million non-buyer households — and the millions of light buyers who buy once a year and might buy more — can only be reached through brand marketing that builds memory structures before those households enter their next purchase moment.
The numbers make the case that a CMO cannot make with qualitative arguments alone. You are not asking for brand budget because "brand is important." You are asking for brand budget because 67.8% of the total addressable market has never bought and cannot be reached through the channel you are currently using.
The critical nuance: stationary vs. growing markets
Dale W. Harrison is a marketing scientist who translates the Ehrenberg-Bass research base into commercial diagnostics for CMOs and category leaders, most publicly through his LinkedIn writing. His work on the 95/5 rule takes the underlying NBD model and extends it into a set of practical implications for how a marketing team should allocate between brand and performance investment. It is worth reading him directly — he cites his sources, and he does not soften the maths for readers who would prefer a more comforting story.
Harrison makes a point that is essential to understand correctly. The 95/5 rule applies to stationary markets — categories that are not growing or shrinking, with a stable buyer population. This is the underlying assumption of Ehrenberg's NBD model.
In rapidly growing categories, the in-market percentage can reach 25–35%. The reason: a growing category contains not just replacement buyers (people re-purchasing what they already buy), but net-new buyers entering the category for the first time. These first-time buyers are all simultaneously "in market" — forming their initial preferences, comparing options, making their first purchase. When this cohort is large, the in-market pool expands dramatically.
For plant-based meat, this distinction is historically visible. From 2018 to 2022, the category was growing rapidly — new households were entering the category for the first time at high rates. Performance marketing was unusually efficient during that window because the in-market pool was genuinely full of new buyers. By 2024, the category had reached a stationary state: penetration had flatlined at approximately 32% for three consecutive years, purchase frequency had stabilised at W=8.4, and the flow of net-new buyers had slowed to near zero. The 95/5 rule now applies in full. The performance advertising efficiency that worked in 2020 will not return through increased performance spend. The next growth phase requires reaching the 67.8% non-buyer pool through brand investment — which is exactly what the 5% calculation explains.
For the CMO, this distinction is a diagnostic tool. If your category is growing rapidly, more than 5% of the market is reachable through performance channels — capture it. If your category has plateaued, the performance ceiling is structural, and the investment needs to shift.
But a growing market brings its own trap. When a category is expanding, absolute revenue rises across every competitor. Your own top line grows and everyone in the business feels good about it. What that number hides is share dynamics. If the market grew 25% and your revenue grew 12%, you have not grown — you have shrunk relative to the competitive set, and the competitors that grew faster than the category have taken your share. In a growing market, share of category is the metric that matters. Absolute volume can rise while competitive position collapses.
This is one of Les Binet and Peter Field's core diagnostics — we return to it in Lesson 5, where we look at how excess share of voice against share of market is the leading indicator that predicts whether a brand is going to grow or shrink. The implication for the CMO is immediate: read your growth rate against the category, not just against your own history. A brand that grew 8% in a category that grew 25% has actually lost ground.
The public example most people are watching in real time is OpenAI. The AI category is growing at rates most industries have never seen. OpenAI is growing in absolute terms — its user counts and revenue continue to climb. But the competitive set has grown faster still. The share of category that OpenAI held eighteen months ago is not the share it holds today, even though absolute revenue is up. This is what losing share in a growing market looks like from the inside — the top line still says growth, and the strategic position is deteriorating anyway. If you cannot see it, you cannot act on it.
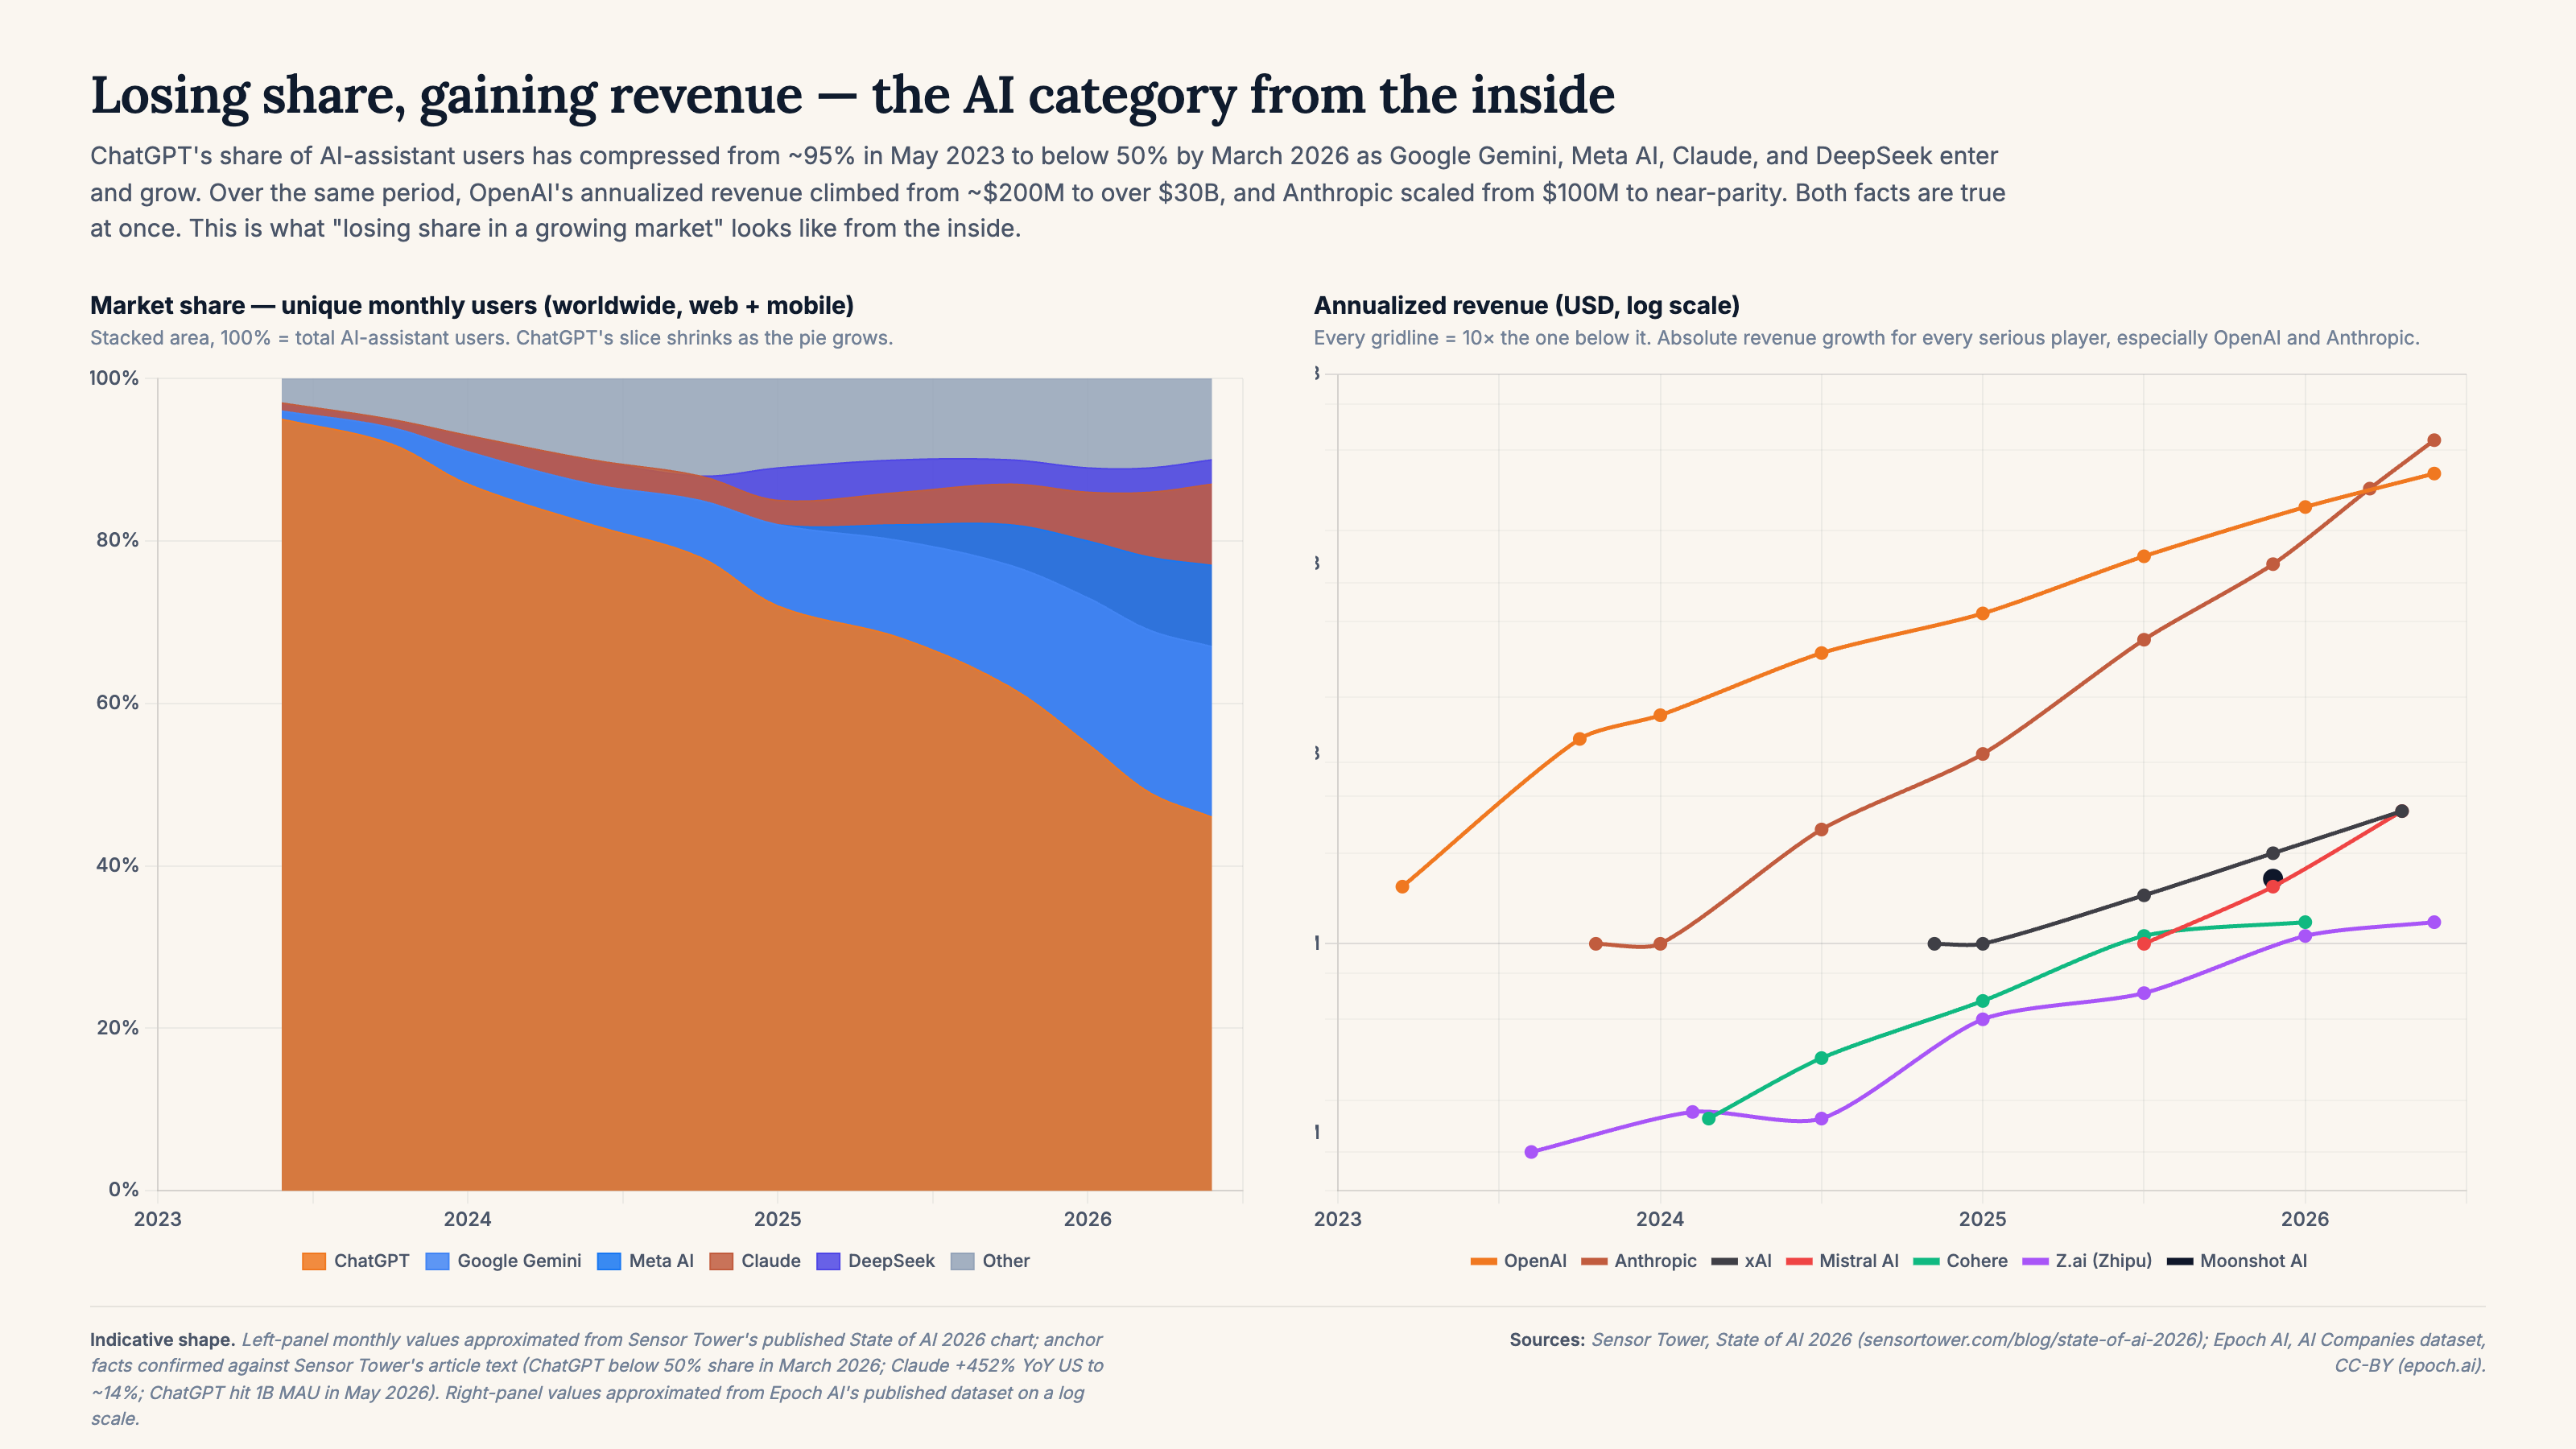
Read the two panels together. On the left, OpenAI's share of AI-assistant users is compressing quarter after quarter — not because ChatGPT is losing users in absolute terms (it isn't; it hit a billion monthly active users in May 2026), but because the competitive pie is expanding much faster than any single competitor can grow. On the right, OpenAI's revenue is climbing sharply on a log scale, and Anthropic is climbing even faster, approaching parity by mid-2026. Both facts are simultaneously true. If your dashboard only reports absolute revenue, you see the right panel. If it only reports users, you see the left panel. The CMO's job is to hold both at the same time — because the strategic decisions in a growing category (where to invest, when to defend, which segments to sacrifice) depend on whether you are winning share or just riding the tide.
What Ehrenberg Found
Andrew Ehrenberg (1926–2010) was a British-born statistician who spent decades — from the late 1950s through the 2000s — studying how consumers actually behave in markets. His foundational paper on repeat-buying behaviour appeared in 1959, and he extended the framework across categories, countries, and product classes for the next fifty years, most influentially with his collaborator Gerald Goodhardt. The Ehrenberg-Bass Institute for Marketing Science, based at the University of South Australia, continues his work today. His method was empirical from the beginning: not how people say they behave in surveys, but how they actually behave, measured across repeat purchases, category switching, and brand preference patterns in real panel data.
The model he developed — the NBD-Dirichlet — describes two things: how often people buy in a category, and which brands they choose when they do. Both findings are counterintuitive, and both have direct consequences for how marketing should be structured.
How often people buy is largely out of your hands. The NBD (Negative Binomial Distribution) part of the model describes purchase frequency in a category. A family with three children buys breakfast cereal frequently. A single professional buys it once a month. Those patterns are set by their household structure, their lifestyle, their routines. They are not meaningfully responsive to advertising pressure. You cannot advertise someone into doing laundry more often than their household requires. Frequency, in most categories, is determined by usage context, not marketing.
The same logic applies across categories set by consumption behaviour. A consumer might buy extra protein powder on promotion — but total consumption is set by how much protein their body actually needs and how often they train. What has changed is not frequency; it is only timing. The purchase next month simply does not happen, because the pantry is already full. Total volume does not increase. The purchase cycle reasserts itself.
This has a specific implication that most marketers spend their careers refusing to accept: loyalty programmes, CRM initiatives, and engagement campaigns that aim to increase purchase frequency among existing customers are fighting a structural ceiling. You are trying to change a behaviour that is shaped by forces you cannot move. The customer who buys detergent once a month buys it once a month because their household runs a fixed number of washes each week. Running another email campaign will not change their laundry schedule.
REWE Group provides a live case study. In 2024, after a decade-long partnership with the PayBack coalition programme, REWE Germany ended the arrangement and launched its own loyalty programme, REWE Bonus, at material cost. The 2025 annual report explicitly names the launch spend for the new loyalty programme as a primary cause of a decline in gross margin — with no reported offset from purchase frequency uplift, penetration expansion, or share gain. The 2026 forecast then tells its own story: the route to hitting next year's margin target is reducing the loyalty spend, not harvesting the loyalty base. Market share disclosure for the food business, which had appeared in prior reports, quietly disappeared from the 2025 narrative — exactly when a Sharp-honest measurement would test the programme's demand-side effect. This is what NBD-Dirichlet mathematics predicts. In a saturated category with stable purchase frequency, a loyalty programme does not meaningfully move frequency because the household still needs the same groceries per week. What the programme delivers is customer data and a marginal defence of mental availability. Neither shows up as demand-side growth in the P&L. Our forensic dossier on the REWE reports is saved at brands/madre-brava/research/retailer-intelligence/rewe-group/intelligence-dossier-loyalty-2026-07-04.md.
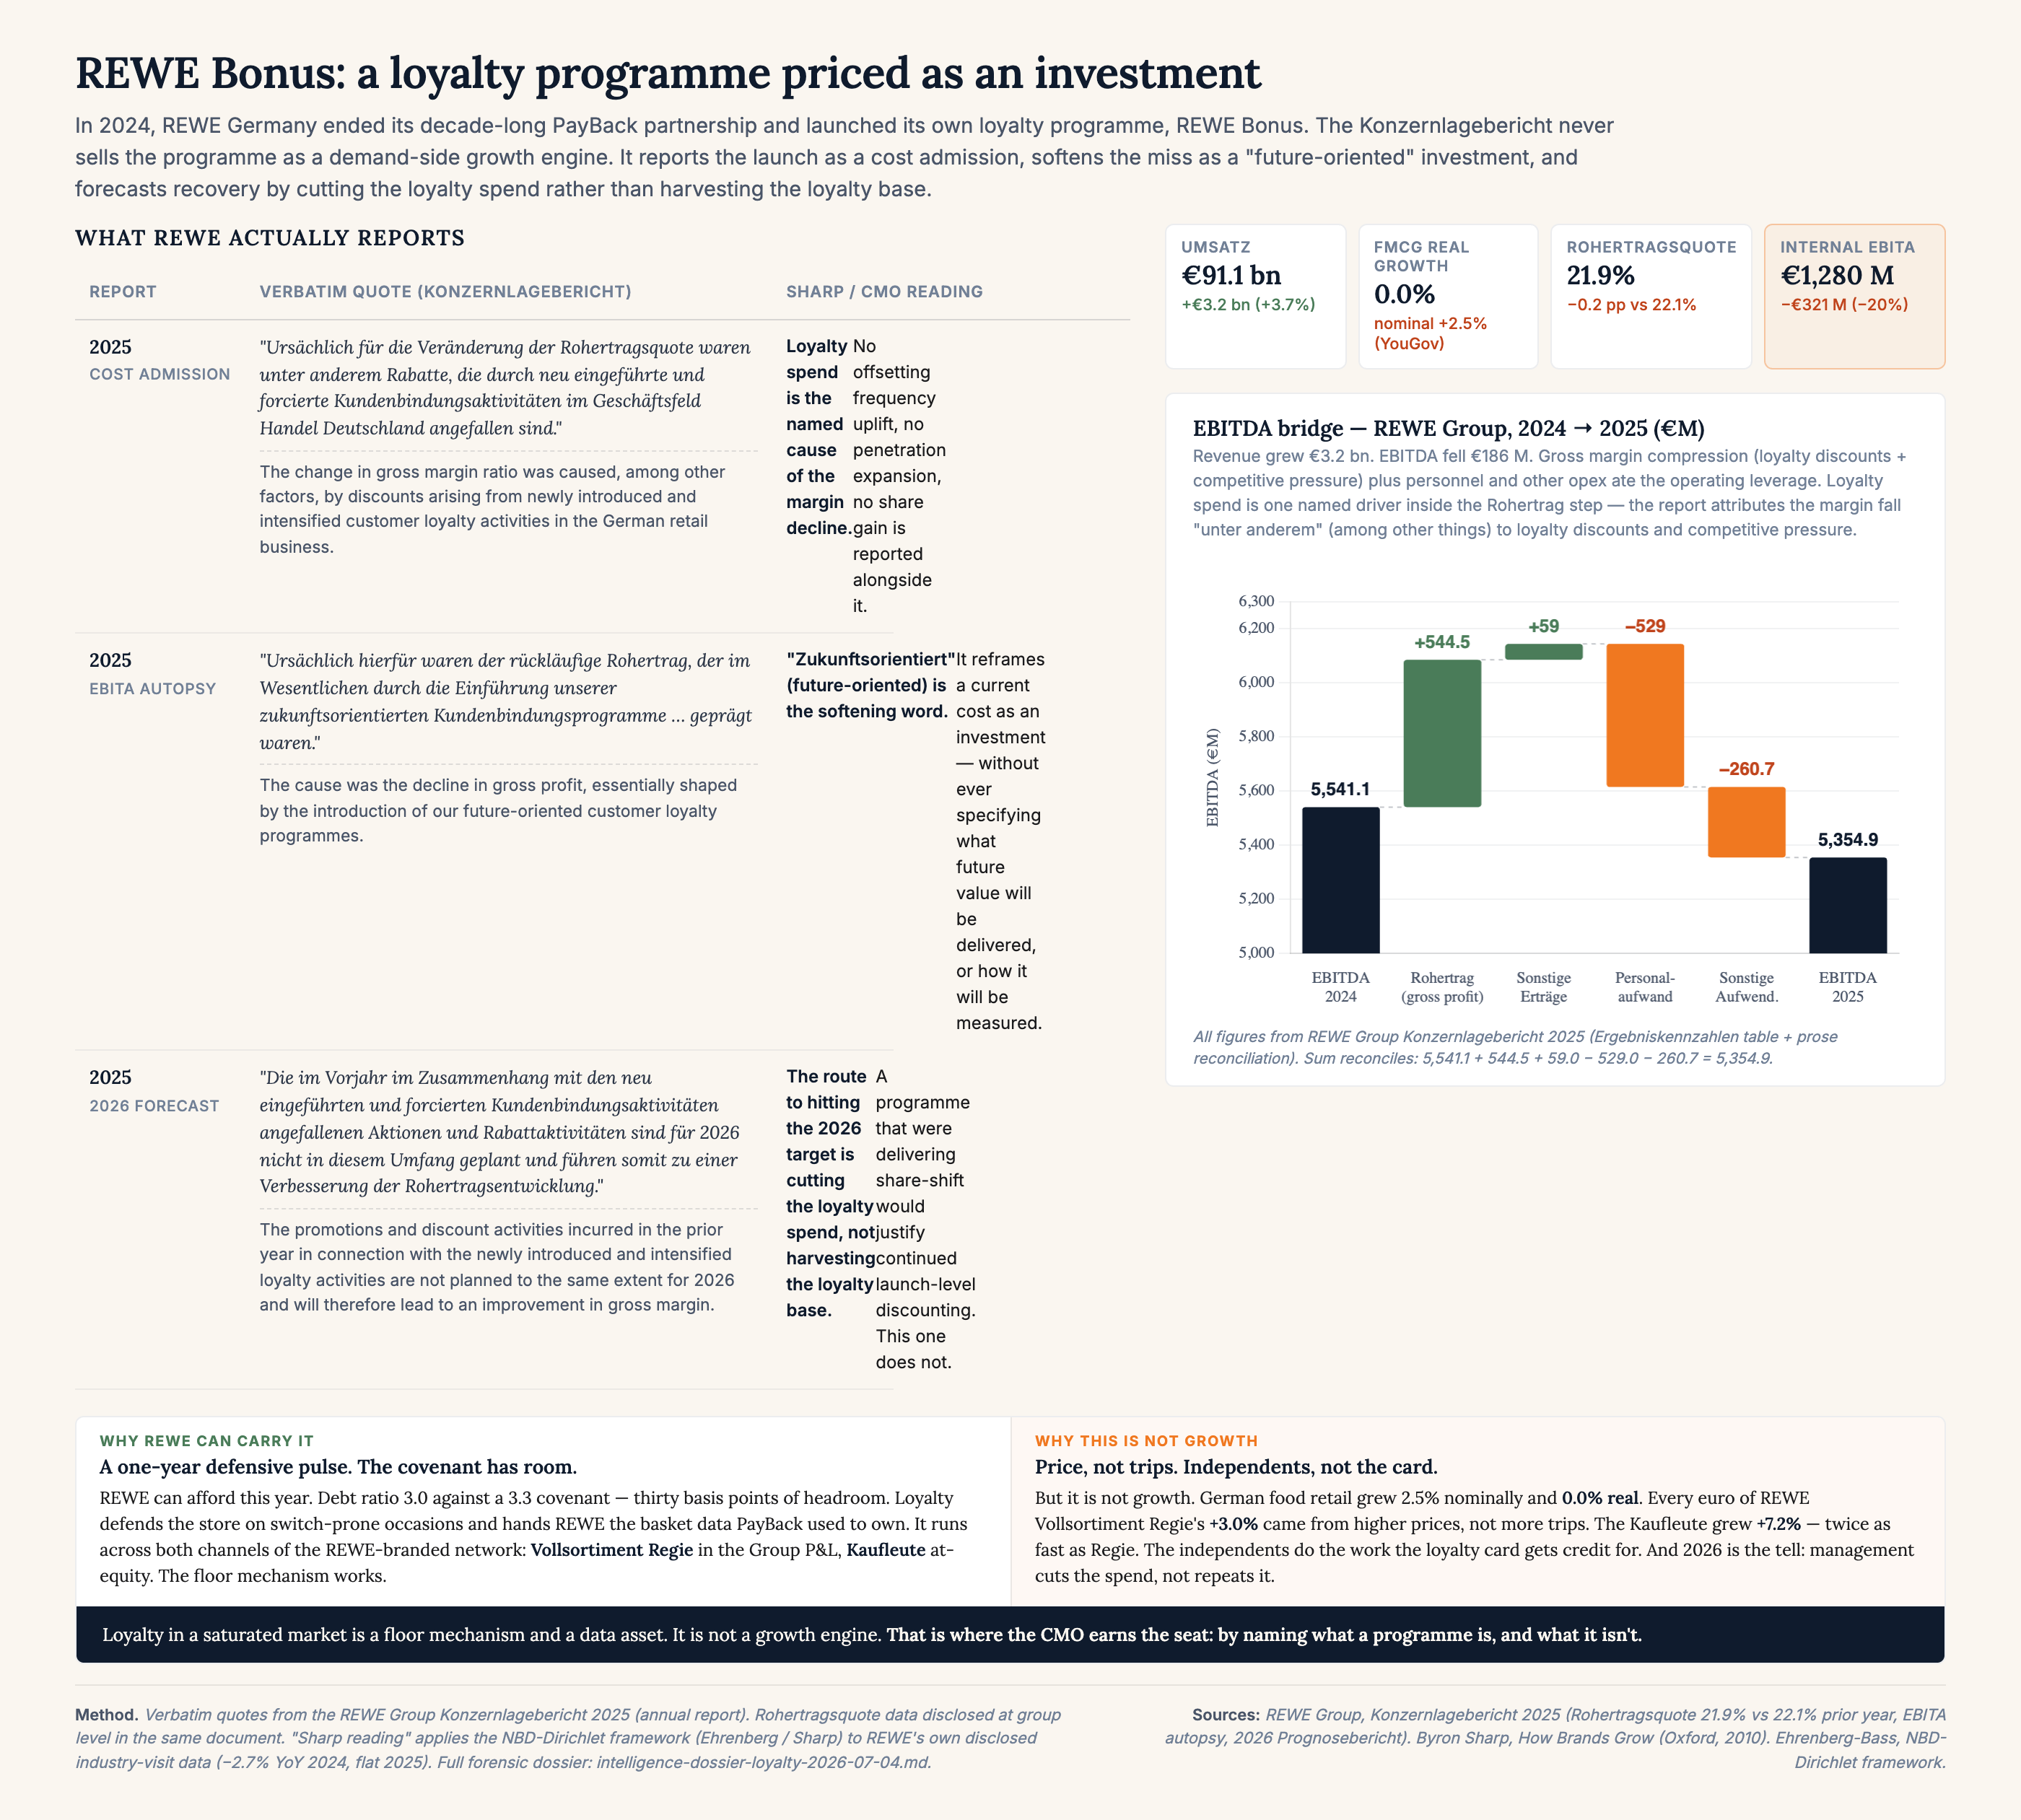
Material: rewe-loyalty-dossier-extract.html · Source dossier: intelligence-dossier-loyalty-2026-07-04.md
Which brand they choose is where marketing does its real work. The Dirichlet part of the model describes brand choice. Buyers hold a mental repertoire of brands they are aware of in a category. When they enter the purchase decision — when their moment of need arrives — they choose randomly from that repertoire (it is essentially a random choice, weighted by the strength of each brand's memory structures). The brand that comes to mind most readily, in the most relevant situations, wins more often.
Not because of loyalty. Not because of a relationship. Not because of content engagement or social media followers. Because of salience: the ease with which the brand comes to mind in the relevant situation.
The specific situational triggers that activate category consideration — the moment when you realise you have run out of washing powder, or you are tired at 3pm and want something to pick you up — are called category entry points. The brand that is most strongly associated with those triggers in memory wins most reliably. We will examine how category entry points work and how to build associations with them in the section on mental availability below.
The Light Buyer Paradox
Here is the finding that most marketing strategies get backwards.
The majority of a brand's sales volume comes not from heavy, loyal buyers who purchase frequently — but from light buyers who purchase rarely. The number of light buyers is enormous; the number of heavy buyers is small. Even though each heavy buyer contributes more revenue per person, the aggregate from light buyers dwarfs it.
To be precise about the terms. A heavy buyer is someone who purchases frequently in your category — in cornflakes, that is the family running through two boxes a week. A light buyer purchases occasionally — the single adult who buys a box twice a year. In most categories, the heavy buyers are a small group and the light buyers are the large majority. Heavy buyers show up most visibly in brand data: they complete surveys, return for repeat purchases, join loyalty programmes. But the aggregate volume from the large mass of occasional purchasers typically exceeds what the heavy buyers produce.
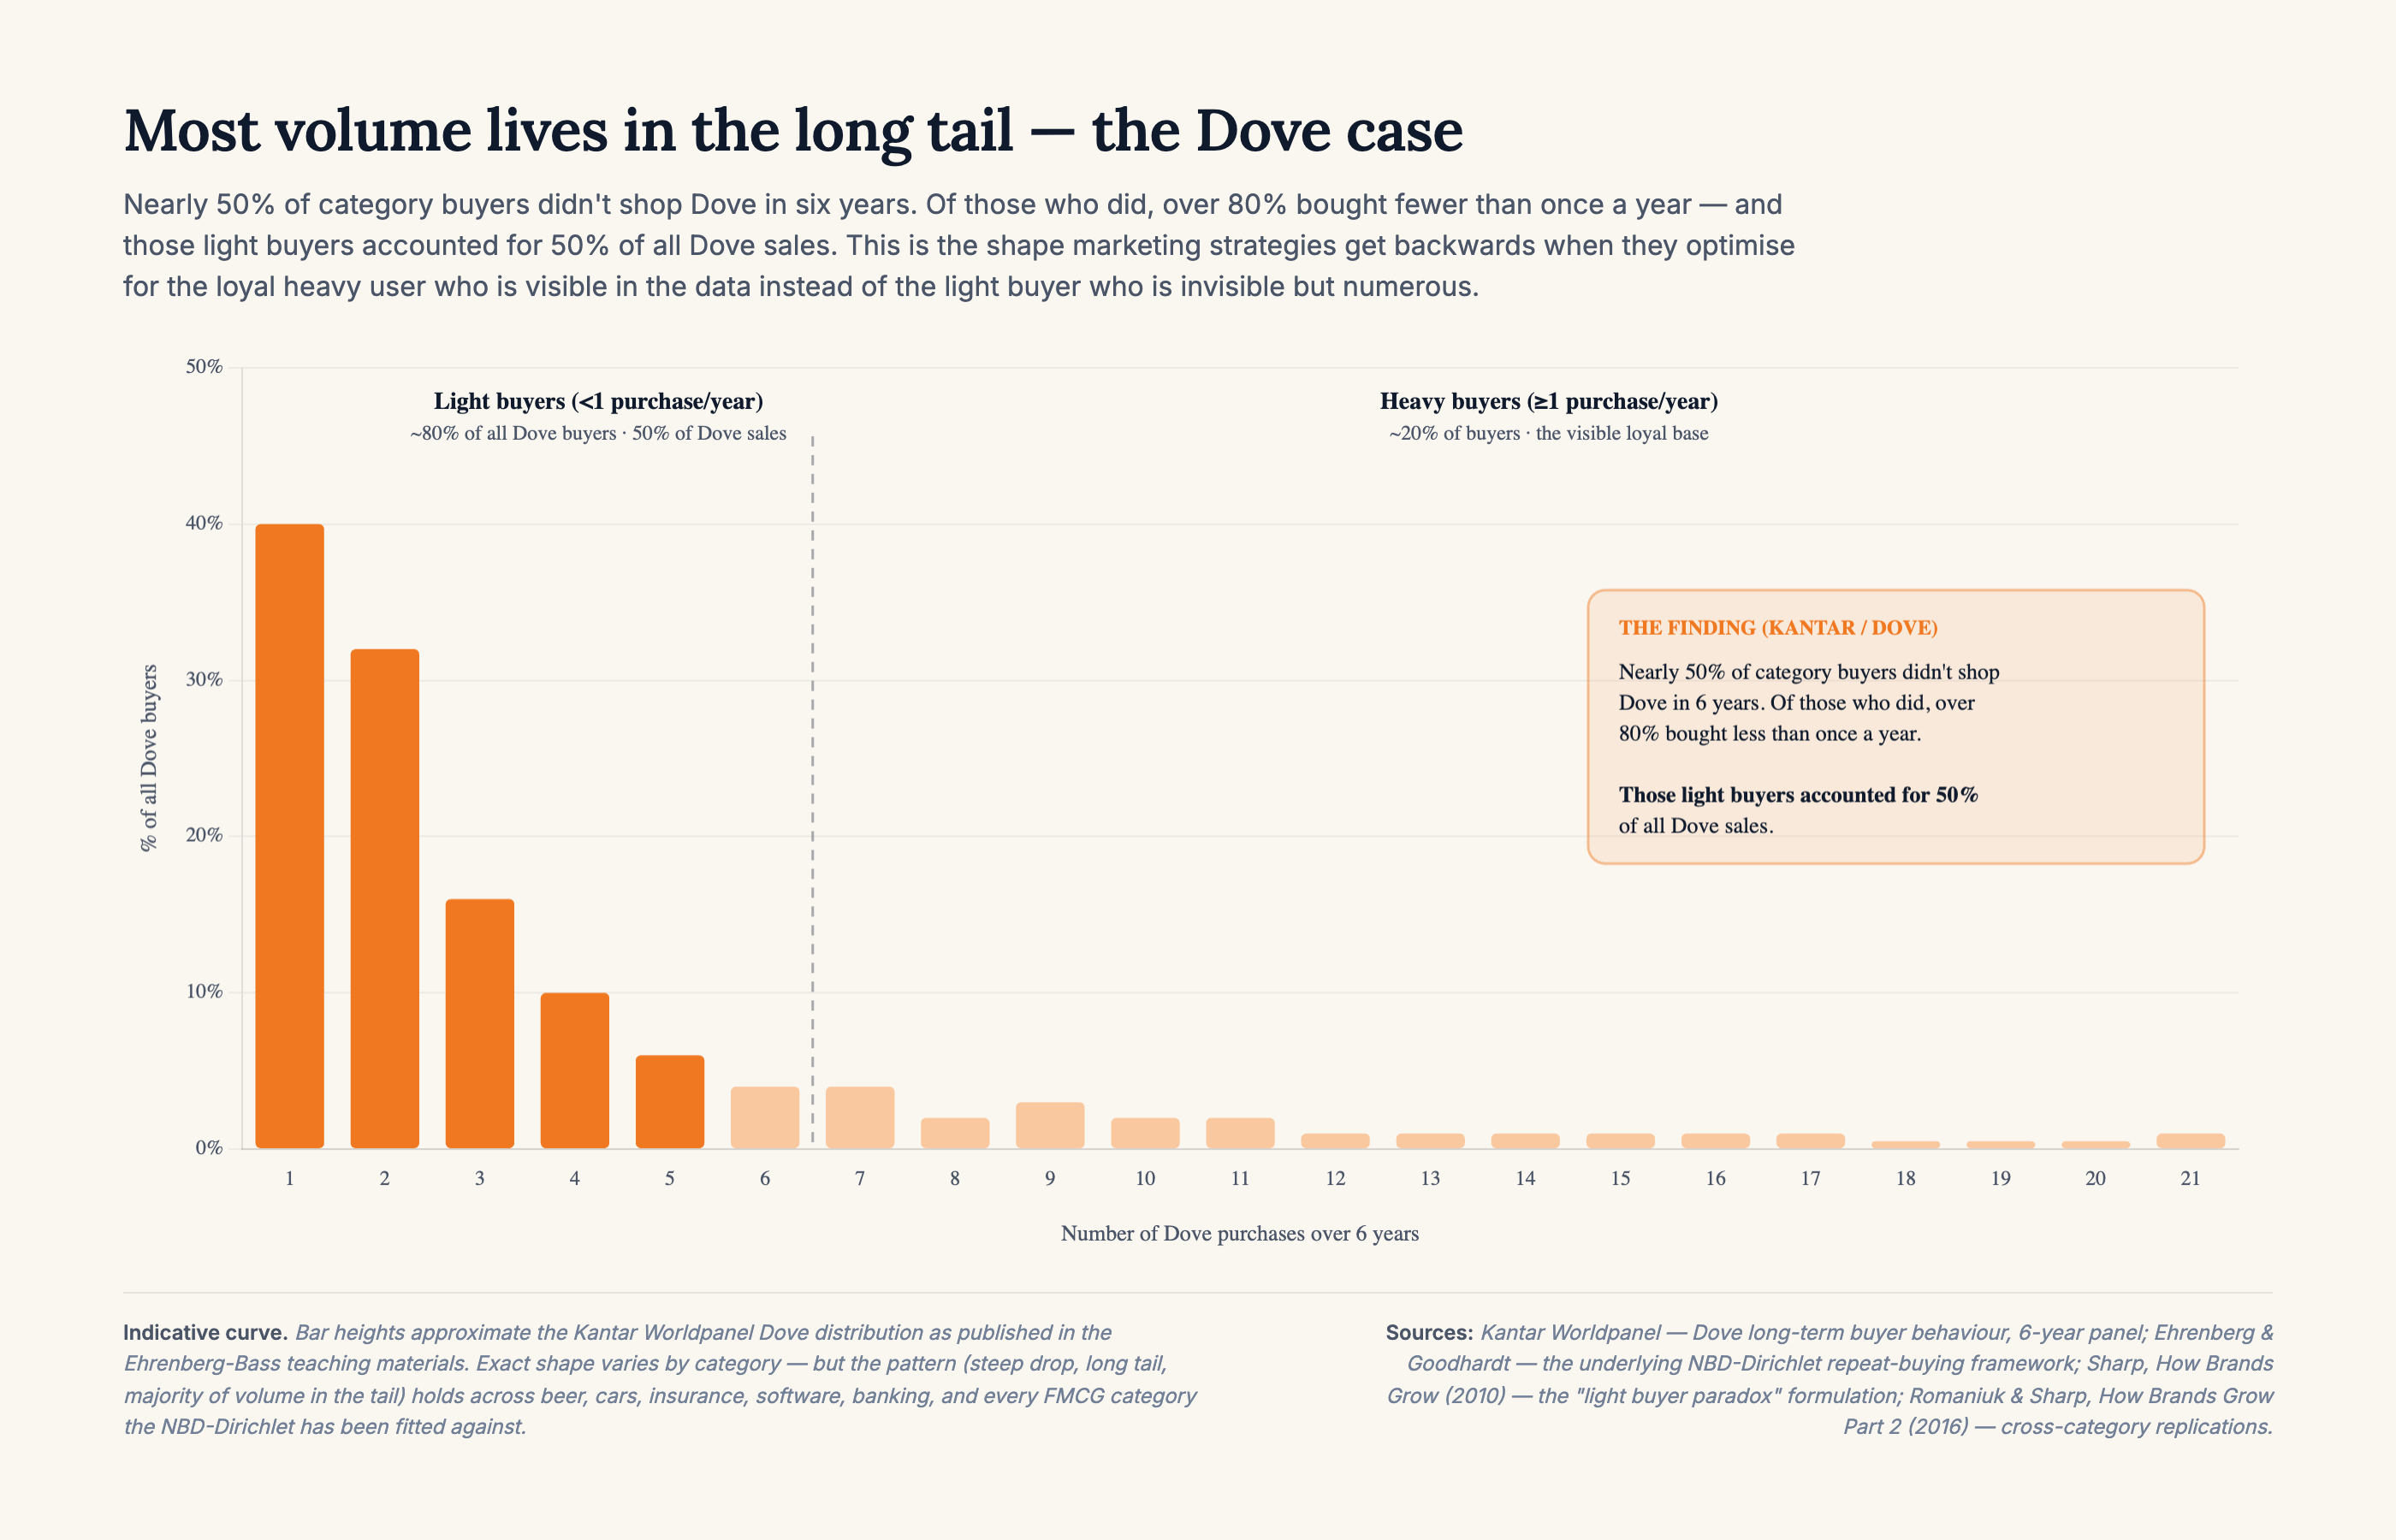
Material: buyer-distribution-curve.html · Data: Kantar Worldpanel on Dove long-term buyer behaviour, as reported in the Ehrenberg-Bass teaching materials. The pattern replicates across every category the NBD-Dirichlet has been fitted against — beer, cars, insurance, software, banking, all FMCG — see Romaniuk & Sharp, How Brands Grow Part 2 (2016).
This is documented across category after category in the Ehrenberg-Bass research. Beer, cars, insurance, shampoo, software, banking — the pattern holds. A relatively small percentage of a brand's buyers account for a large percentage of its volume, but the largest source of overall volume growth is extending reach into the large pool of occasional buyers, not deepening frequency with the heavy users.
What this means for budget allocation: optimising your marketing for your most engaged, most loyal, most frequent customers — the people who already buy you and tell their friends — is optimising for the smallest part of your growth opportunity. The biggest opportunity is the people who buy your category occasionally and have not yet formed a strong preference for you.
This is counterintuitive because your loyal customers are visible. They show up in your CRM. They comment on your social posts. They complete your NPS surveys. They give you the feeling that you have a community. Your light buyers are invisible. They do not follow you. They do not engage with your content. They are simply, occasionally, buying your product — or your competitor's — based on which brand comes to mind most readily.
Marketing that optimises for the visible community misses the invisible mass. Marketing that reaches the invisible mass compounds.
Double Jeopardy: The Law Nobody Enforces
The Double Jeopardy Law is one of the most robustly documented empirical regularities in marketing science. Ehrenberg established it. It has been replicated across dozens of categories in dozens of countries. And it is almost universally violated in how marketing strategies are built.
The law states: smaller brands suffer on two dimensions simultaneously. They have fewer buyers. And their buyers also buy them less often. The two deficits are not independent — they are linked. They arise from the same underlying cause: low penetration produces low mental availability, which produces both fewer buyers and lower purchase frequency among those who do buy.
The implications are exact. A brand that grows its market share grows on both dimensions: more buyers, and slightly more frequent purchase among all buyers. A brand that declines loses on both. There is almost no way to grow one without the other.
This creates a diagnostic tool. If your brand has a loyal but small customer base — people who buy frequently but there are not many of them — the answer is not to deepen their loyalty. The answer is to grow the base. The loyalty numbers will improve as a consequence of reaching more buyers and building stronger mental availability across a wider pool.
Conversely, a brand that is losing share should not run loyalty programs. It should diagnose why it is losing buyers and why its mental availability is weakening. The loyalty score is a symptom, not the disease.
Penetration Is the Primary Growth Lever
If Double Jeopardy tells you that the two deficits (fewer buyers, lower frequency) are linked, then the obvious conclusion is that growth requires solving the penetration problem, not the loyalty problem.
Byron Sharp is the Australian marketing scientist who inherited Ehrenberg's empirical tradition and made it operational for practitioners. His 2010 book How Brands Grow — followed by How Brands Grow, Part 2 with Jenni Romaniuk in 2015 — took decades of NBD-Dirichlet research and translated it into a set of laws a marketing team can act on. Sharp is the director of the Ehrenberg-Bass Institute, where the research continues to be extended across categories, countries, and B2B markets. His formulation is the one most CMOs know by name.
Sharp's formulation is clear: brands grow primarily by increasing penetration — reaching more buyers, even slightly more often — not by deepening the loyalty of existing buyers. The mathematical evidence supports it. The vast majority of the people who will buy your brand next year have either not bought you this year at all, or have bought you only once or twice. Reaching them is more valuable than sending another campaign to your existing subscribers.
This does not mean existing customer relationship management has no value. Retention matters. A brand with high churn loses ground it has gained. But retention is a floor, not a ceiling. You protect what you have through retention. You grow by reaching new buyers.
The REWE example above sits exactly inside this framing. A loyalty programme can defend the buyer base you already have — a floor mechanism. It cannot lift the growth ceiling. Confusing the two is expensive, as REWE's own P&L now shows.
The practical implication: a campaign optimised for your existing buyer base is almost certainly over-indexed for a small audience. A campaign optimised for broad reach in the target category — including the occasional buyers and the non-buyers who might enter the category in the next twelve months — is addressing the actual growth opportunity.
Consider Nokia. Awareness in the German market is close to universal — anyone over thirty grew up with the brand, and the name still activates instantly in memory. But the mental availability of Nokia in the moment of buying a phone today is close to zero. The brand's associations with the smartphone category never rebuilt after they were lost to Apple and Samsung a decade ago. Awareness stayed. The associations that convert awareness into purchase did not. The buyer knows Nokia exists. They do not think of Nokia when they think of a phone. This is what a known-but-not-bought brand looks like on the inside.
It is worth being precise about what broad reach is building: not brand awareness, but mental availability. These are different things. Brand awareness is binary — a buyer has either heard of your brand or they have not. Mental availability is a probability — how readily your brand comes to mind in a specific purchase situation. A buyer can be fully aware of a brand and never choose it, because no strong association connects that brand to their particular category triggers. Awareness is the starting point. Mental availability is what converts awareness into choice. Broad reach builds associations. Narrow reach confirms the ones you already have.
How Mental Availability Is Actually Built
Mental availability is not awareness. That distinction matters.
Brand awareness is a binary question: have you heard of this brand? Brand awareness is relatively easy to achieve and relatively fast to build with sufficient media investment. A single well-placed campaign can move awareness numbers meaningfully in a few weeks.
Mental availability is something deeper. It is the probability that your brand comes to mind when a buyer enters a relevant category situation. It is built through the association of your brand with a network of category entry points — the situations, needs, occasions, and emotions that trigger category consideration.
Think about how a purchase decision actually begins. Someone is tired in the afternoon and wants something to pick them up. That is a category entry point for energy drinks, coffee, chocolate, and three dozen other categories. Someone is buying a birthday gift and doesn't know the recipient well. That is a category entry point for gift cards, flowers, wine, and experiences. Someone is worried about their cholesterol after a doctor's visit. That is a category entry point for reduced-fat dairy, oat products, and dietary supplements — and, downstream from that same trigger, for gym memberships, cookbooks on Mediterranean eating, appointments with a dietician, statin medication, home cholesterol test kits, second opinions from another doctor, and the sports shoes that will make the recommended daily walk feel less like a chore. One health worry cascades into dozens of adjacent categories, all activated by the same moment. This is what "category" actually looks like from the buyer's side — a much larger and stranger network than the industry construct suggests.
Mental availability is built by consistently associating your brand with the specific category entry points that are most relevant to your buyers. A brand that is associated with only one entry point is fragile — if that entry point becomes less relevant, or if a competitor claims it more strongly, the brand loses ground. A brand associated with multiple entry points across a wide buyer population is resilient and compounding.
This explains why brand advertising works differently from performance advertising, and why it cannot be replaced by it. Performance advertising reaches buyers at their specific category entry point — the moment of active search or demonstrated intent. Brand advertising builds the association with category entry points across the full population of potential future buyers, at a time when they are not actively searching, so that when they do enter the category, your brand is in the consideration set.
The memory structure is built when people are not buying. It is used when they are.
Measuring mental availability — the research method and the practical proxy
Mental availability can be measured directly — but doing so properly requires formal brand research. Jenni Romaniuk at the Ehrenberg-Bass Institute has developed the methodology in detail, and any CMO commissioning brand health research should understand what is being measured and why. A CEP-based questionnaire template you can adapt to your own category is in the appendix — see the Mental Availability Diagnostic Kit. It contains a fillable Romaniuk CBM questionnaire, the three-matrix (Actual → Expected → Deviation) workbook logic, and a live heatmap built from a real DACH oat-drink study.
The survey-based approach works as follows. You recruit a large sample of category buyers — typically several hundred to over a thousand respondents, depending on the category. You present each respondent with a series of category entry points: specific situations, needs, and moments that trigger category consideration. For each CEP, you ask which brands come to mind. From the responses you calculate three things:
- Mental market share: what proportion of all brand-CEP associations in the market belong to your brand. This is the equivalent of market share, measured in minds rather than purchases.
- Network size: how many different category entry points your brand is associated with across the respondent pool. A large network means the brand is present across a wide range of buying situations — more fragile competitors have a narrow network, tied to one or two situations.
- Mental availability: the probability that your brand will come to mind in a randomly selected category buying situation. This is the number that drives purchase — not awareness, not preference, but the automatic activation rate.
This research is powerful, but it is not cheap or fast. The questionnaire is complex, the sample size requirement is substantial, and the analysis requires care. A sample measurement questionnaire is included in the appendix of this course.
For most businesses — especially those without dedicated brand research budgets — there is a practical proxy for measuring mental availability that is free, trackable, and has been shown to predict mental availability movements before they appear in sales data: share of search.
Share of search is the proportion of total category search volume that your brand captures by name. If 100,000 people search for something in your category each month and 18,000 of those searches include your brand name, your share of search is 18%. As your brand builds more mental availability — as more buyers associate it with more category situations — more of them search for it by name before purchasing.
The evidence from Les Binet's research and subsequent work by Google establishes that share of search leads market share by approximately six months. A decline in share of search today predicts a decline in market share two quarters from now. This makes it one of the most valuable early warning signals available — at zero cost.
Track your brand's share of search against your primary competitors monthly using Google Search Console and Google Trends. Beyond your brand position, share of search also tracks category growth: if total category search volume is rising, the category is growing in interest — new buyers are entering. If total search volume is flat or declining, the category may be maturing or contracting. This makes share of search a two-dimensional indicator: it tells you both where you stand relative to competitors and whether the overall market is expanding or shrinking.
[MATERIAL TODO — Share of Search Tracker] A hands-on build-your-own-tracker module lives in the GPS AI course. Uses Claude Code to pull Google Trends + Search Console data, computes share of search vs a competitor set, tracks category growth, and outputs a monthly dashboard. Cross-sell entry point for CMO-course readers.
Reach, Frequency, and the Law of Leaky Bucket
If mental availability is built through consistent presence across a wide audience over time, the question becomes: how much presence, to how many people, how often?
Marketing science gives a clear orientation, though the exact parameters vary by category and competitive environment. The general finding is that reach is more valuable than frequency in most brand-building contexts, up to a threshold.
This runs against the intuition of most digital marketers, whose platforms are optimised to show your ad to the same person multiple times because their algorithm predicts that person is interested. Frequency is what platforms sell because frequency is what their models are optimised for. But from a mental availability building perspective, showing the same ad ten times to the same person produces diminishing returns after the first few exposures. The tenth exposure builds almost no incremental memory structure. That budget would build more mental availability if it reached ten different people once each.
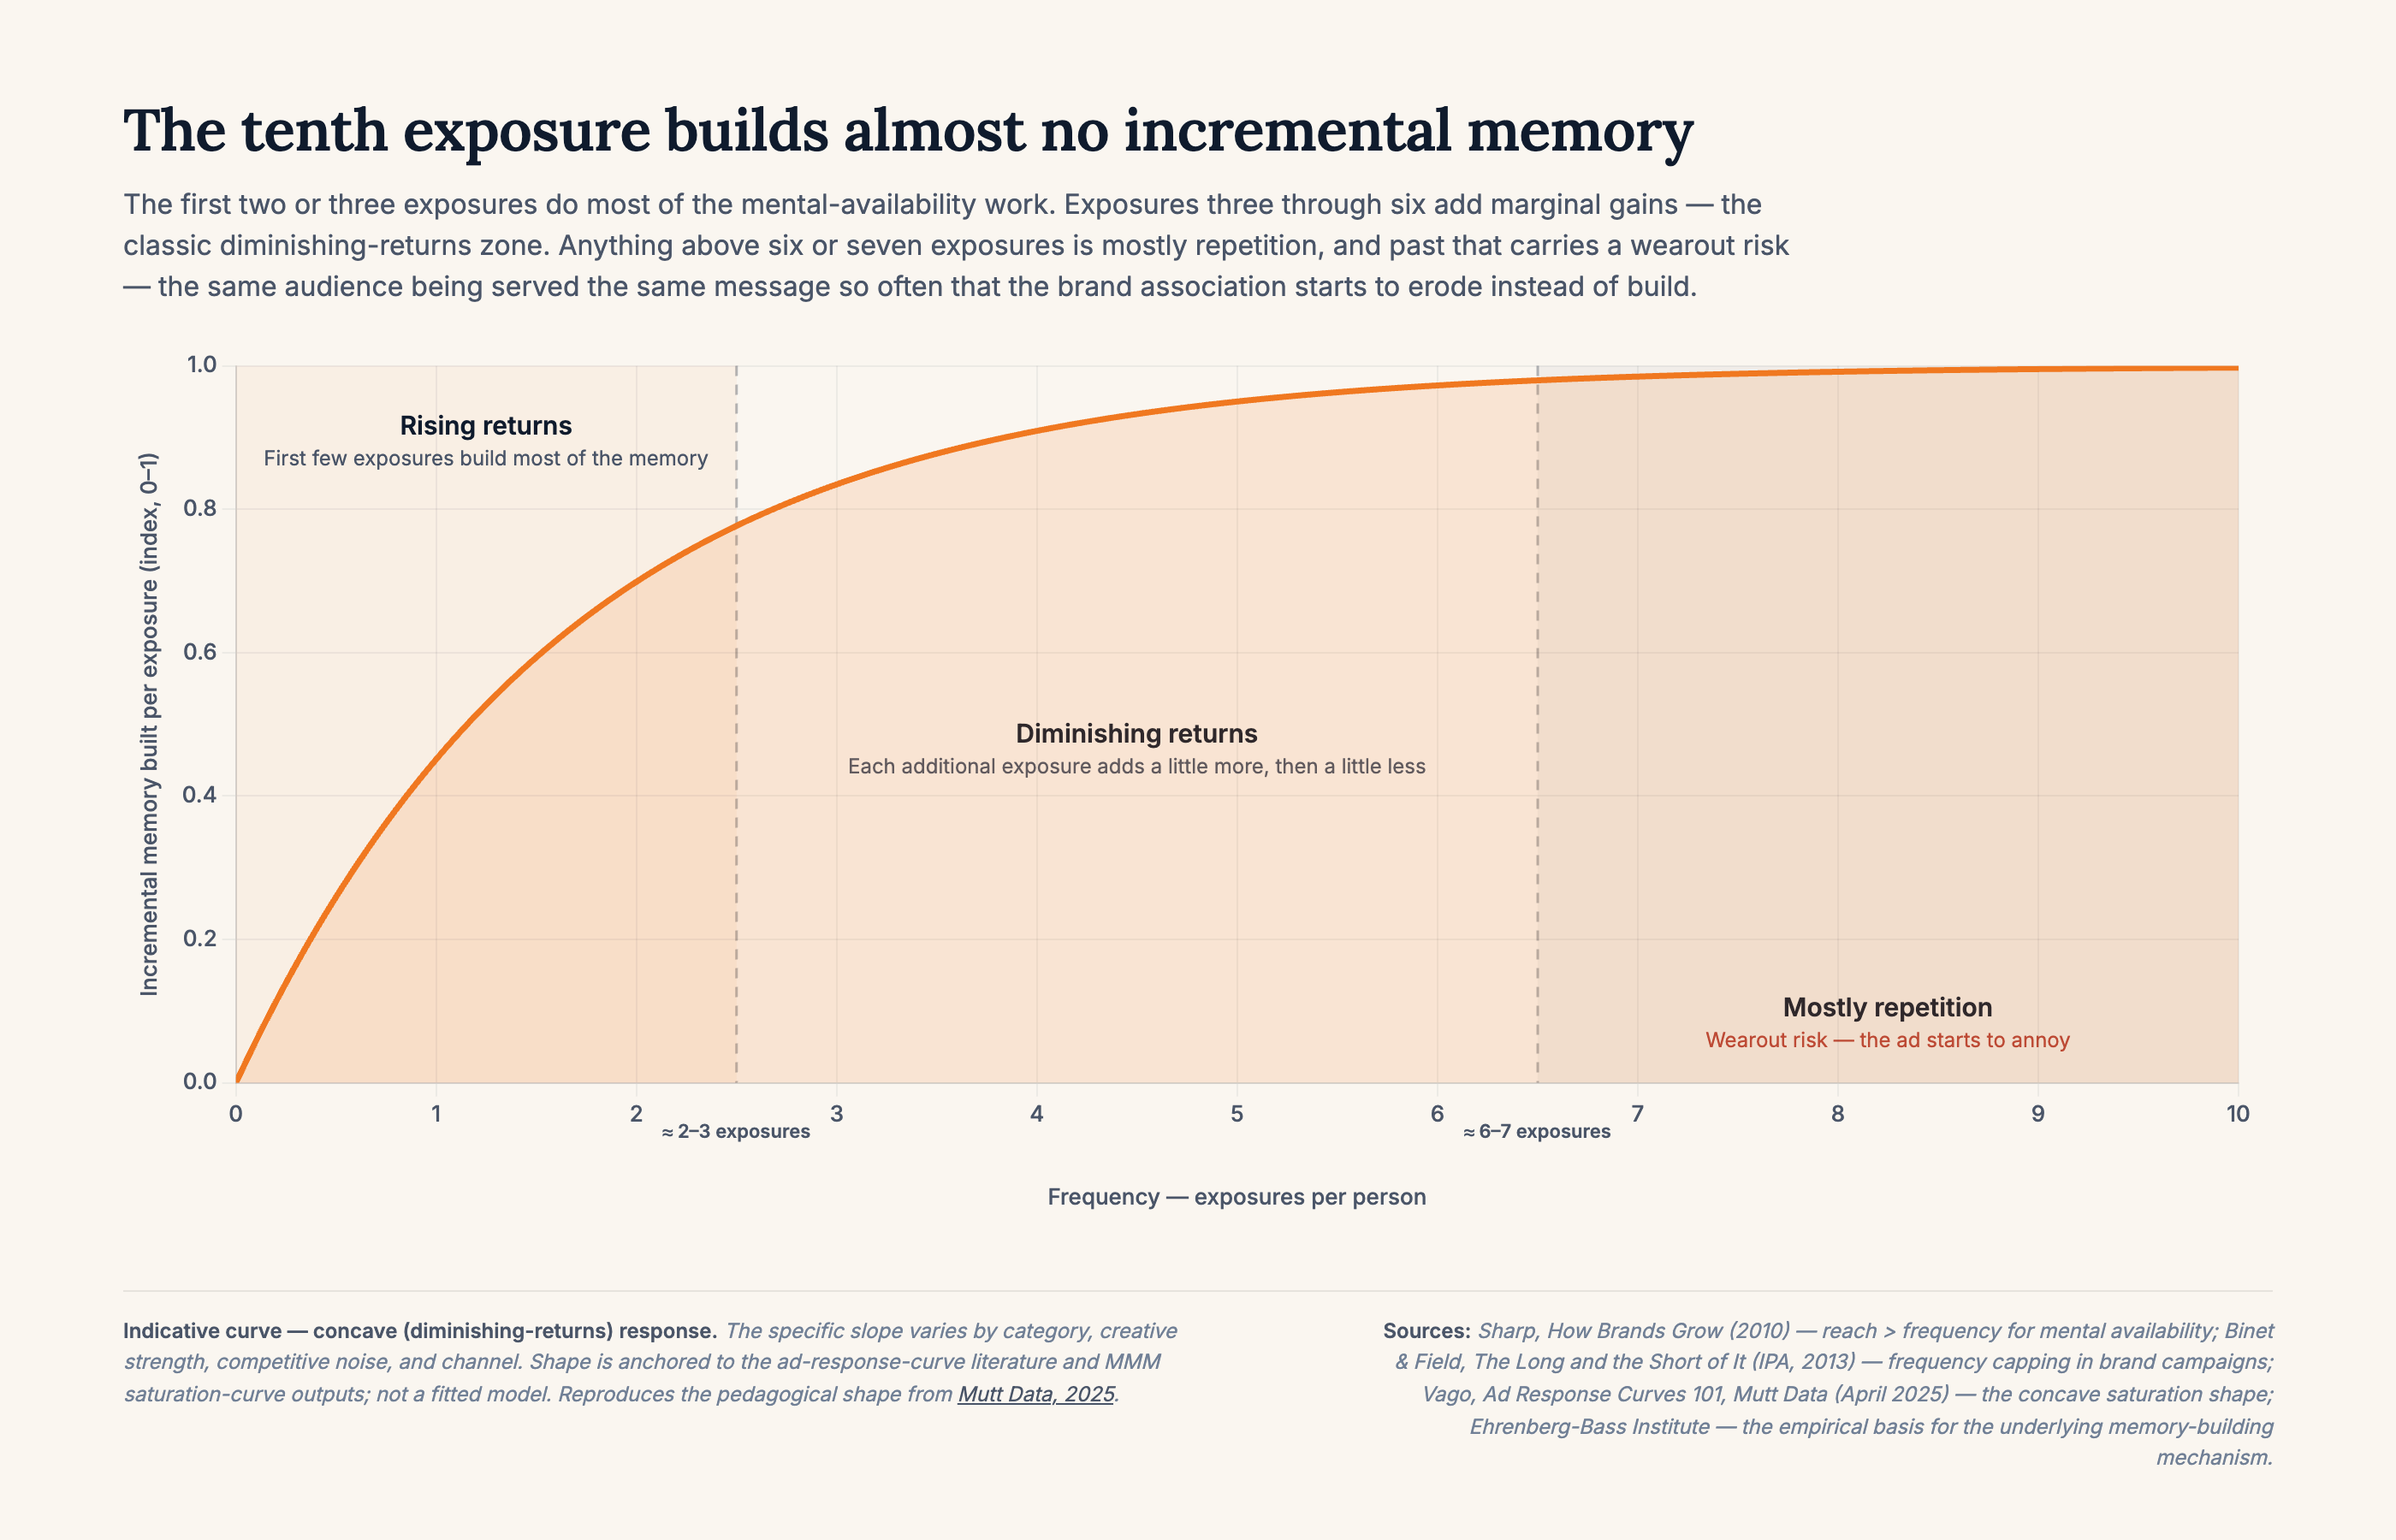
Material: frequency-diminishing-returns.html · Shape anchored to the ad-response-curve literature and MMM saturation-curve outputs — the concave (diminishing-returns) form is the most common curve shape in advertising per Mutt Data (2025), consistent with Sharp's reach>frequency finding and Binet & Field's IPA frequency-capping guidance.
The practical implication: campaign targeting that maximises reach across a broad audience, with a frequency cap that limits repetition to a handful of exposures per person, is typically better for mental availability building than narrow targeting with high frequency. A smaller, highly retargeted audience is being over-served. The large, lightly touched audience that your performance targeting ignores is where the mental availability building happens.
Byron Sharp's recommendation — reach as many buyers in the category as possible, as consistently as possible, over time — is the orientation. Not "find the most likely buyers and talk to them a lot." Find everyone who might buy and be consistently present in their memory.
Distinctive Assets: The Shortcut to Salience
Mental availability is built slowly, over time, through consistent advertising. Distinctive brand assets are the mechanism that compounds that work — not a shortcut, a compounding effect. Jenni Romaniuk's research at the Ehrenberg-Bass Institute, summarised in Building Distinctive Brand Assets (2018), documents the mechanism directly: a consistent, ownable visual, auditory, or linguistic anchor lets the buyer's brain match the asset to the brand automatically. Every subsequent exposure builds memory faster than one without an anchor. The research is empirical, replicated across categories, and specific about how the effect is measured — it is not a marketing slogan dressed up as science.
A distinctive brand asset is an element — visual, auditory, linguistic — that is strongly associated with your brand and almost nobody else. Not your logo, necessarily. Something more specific: a colour, a character, a shape, a sound, a phrase. Something that, when buyers encounter it, immediately and automatically activates the brand in memory without requiring conscious processing.
Think about how buyers learn to read visual cues from early childhood. Red means danger — every stop sign in the world reinforces that. Red-and-white on a can signals a specific soft drink. Blue-and-yellow on a warehouse-scale storefront signals a specific furniture retailer. The silhouette of a certain glass bottle signals a certain cola without a word of text on it. These are not accidents. They are decades of consistent, disciplined asset investment by brands that understood the memory structure they were building. The buyer does not think "that's Coca-Cola" — the buyer just knows.
The best-executed distinctive asset systems in the world do not rely on a single asset — they compound across categories. McDonald's is the standard case. Golden arches (logo). Red and yellow (colour). "I'm Lovin' It" (words). The five-note "ba da ba ba ba" (sonic). Each of these can activate the brand in memory on its own, in the absence of the others. When you see a red and yellow sign at 300 metres on a motorway, the brand fires in your head before you have consciously read the letters. When you hear the five-note bar in an ad you are half-watching, the brand fires before the visual arrives. The parallel-channel structure is what makes the memory retrieval near-automatic.
Six categories of distinctive brand asset are worth auditing in any brand, and the textbook examples for each are covered in the companion material: Distinctive Brand Assets — The Six Categories. The material includes the Ritson–Sharp Cannes 2026 exchange in which Ritson publicly renamed his MiniMBA "brand codes" module to "distinctive brand assets" — a moment worth marking because it signals the end of a fifteen-year terminology war between the positioning tradition and the Ehrenberg-Bass tradition.
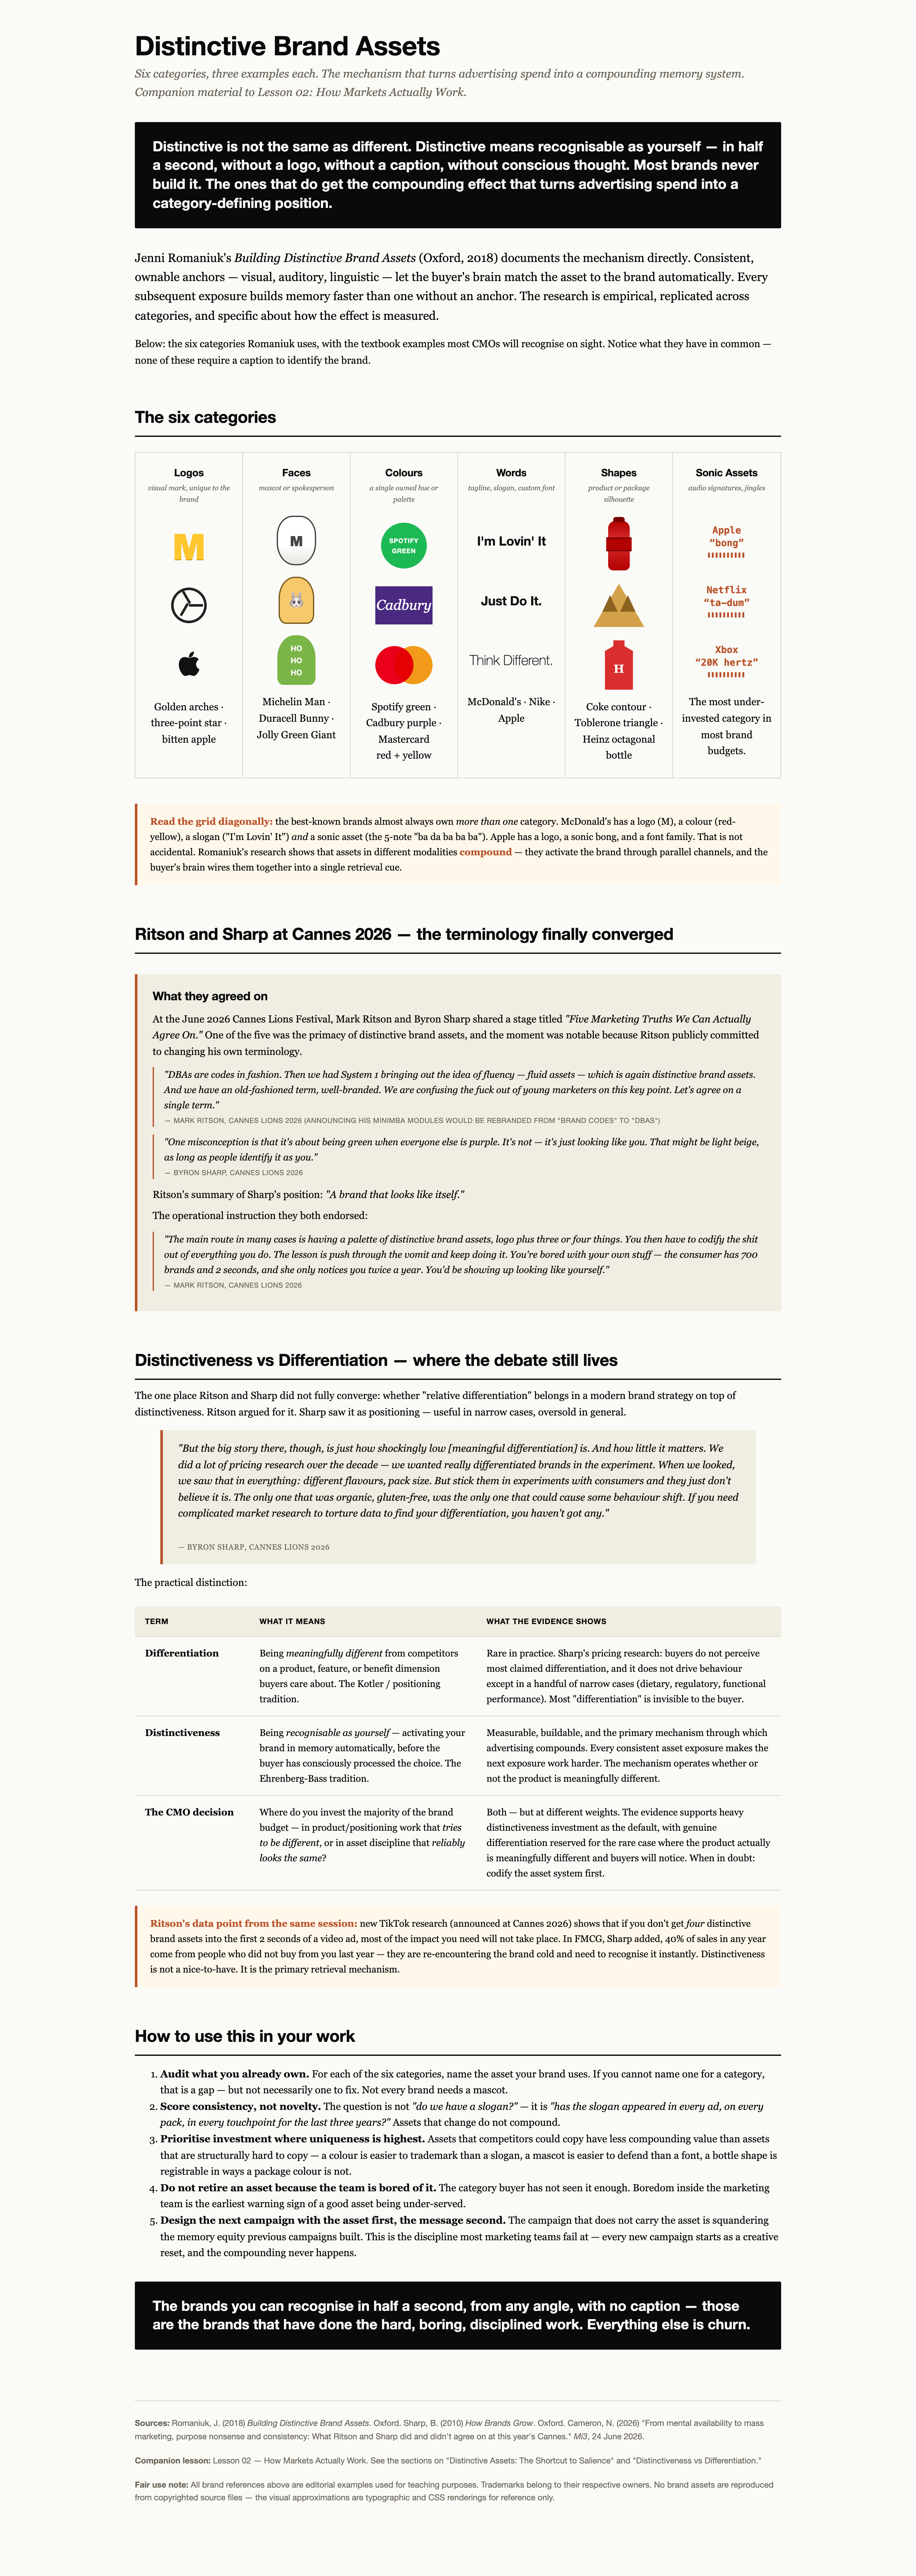
Material: distinctive-brand-assets.html · Source: Romaniuk, Building Distinctive Brand Assets (Oxford, 2018).
Think of the specific yellow of a certain energy drink, the sound of a certain technology company's startup sound, the shape of a certain perfume bottle, the character of a certain insurance brand. These are not just visual identity elements. They are memory shortcuts. A buyer who has encountered these assets many times over many years processes them automatically — the brand activates in memory before they have consciously thought about it.
This is neurologically significant — and it connects to two bodies of research that any CMO working at board level should understand.
Daniel Kahneman was an Israeli-American psychologist who won the Nobel Prize in Economics in 2002 for the work he did with Amos Tversky on how people actually make decisions — work that founded the field of behavioural economics. He died in 2024. His dual-process theory, developed over decades of research and made accessible to a general audience in Thinking, Fast and Slow (2011), describes two distinct modes of cognition. System 1 is fast, automatic, and unconscious. It runs continuously, processes pattern recognition, and makes the vast majority of our moment-to-moment decisions without our awareness. System 2 is slow, deliberate, and effortful — it activates when we need to work through a complex problem, but it is metabolically expensive and tires quickly. Wherever possible, the brain defaults to System 1.
Think of it as the difference between driving a familiar route home and solving an equation. Driving, once you have learned it, runs on autopilot — you can hold a conversation, plan tomorrow's meeting, and still arrive at the correct exit without conscious attention. That is System 1. Solving the equation requires you to stop, focus, and hold each step in working memory. Any distraction and you lose the thread. That is System 2. Driving used to be System 2 — the first time you learned it, every action required full attention. Repetition moved it into System 1, where it became automatic. Marketing works on the same mechanism at population scale: what is deliberate today becomes automatic after enough consistent exposure.
Most purchase decisions — especially in low-involvement categories — are System 1 decisions. We do not carefully evaluate every option in the detergent aisle. We reach for the one we recognise. We do not deliberate at length over which brand of yogurt to pick up. We choose the one that comes to mind most readily in that context. System 1 operates through associations, shortcuts, and memory patterns. Distinctive brand assets are designed precisely to activate those patterns: the buyer's brain processes the familiar colour or character automatically, the brand activates in memory, and the choice is made before conscious evaluation begins.
Watch a small child learning colours and shapes. First they struggle to name red versus orange. Then they name it correctly on request, deliberately — System 2 work. Then it becomes instant, automatic — System 1. Later, the same automatic system gets loaded with cultural code: red-and-white on a can signals a specific soft drink, blue-and-yellow signals a specific furniture retailer, the shape of a certain glass bottle signals a certain cola. This is not accidental. Brand creation and design are the deliberate construction of symbolic meaning that the buyer will process implicitly — the cultural codes that let the brand be understood without conscious thought.
Phil Barden is a marketing practitioner who spent his career inside large consumer brands before founding Decode Marketing, a consultancy that applies behavioural science to brand strategy. In Decoded: The Science Behind Why We Buy (2013), he takes Kahneman's framework and translates it directly for marketers, explaining how every brand carries implicit meaning — a set of associations built up through years of consistent exposure. These associations live in System 1. They are not consciously held opinions about the brand; they are automatic responses. A packaging colour triggers a category expectation (yellow and red signals speed and energy; blue signals cleanliness and reliability; black signals premium or luxury). A character activates a personality. A shape can signal a category norm or break it deliberately. The buyer processes all of this in a fraction of a second before any explicit evaluation begins.
What Barden operationalises is the concept of implicit value. Consumers do not evaluate brand meaning consciously in the moment of purchase. They register it automatically, and it shapes their choice before they have thought about it. The brand with the strongest implicit value associations in the relevant context wins the System 1 scan of the shelf — or the mental scan of the consideration set.
At Veganz, we ran this research for ourselves. We wanted to understand what our brand activated in System 1 — what implicit values buyers associated with it before any rational thought. The result was clear: Veganz was the brand for excitement and adventure. Not the brand for calmness and safety — those were category associations shared with every competitor. Our distinctive implicit value was excitement.
The implication was concrete, because consumer choice is context-dependent at the System 1 level. Someone who has just had a conflict with a colleague before lunch reaches for the brand that feels safe and reassuring — in that moment, their System 1 is seeking security. Someone who has spent two hours on a monotonous task wants stimulation — their System 1 is seeking adventure and novelty. A brand that consistently activates excitement and adventure will be preferred in the second context and lose to security-signalling competitors in the first.
Knowing this shaped every communication decision. Every visual, every campaign, every packaging iteration reinforced the excitement dimension — not as an arbitrary creative choice, but because we understood that the System 1 association was already built, and weakening it would cost us the purchase moments where it was the dominant value.
A brand with strong distinctive assets is processed automatically — its implicit value is clear and consistent across the buyer population. A brand without them requires the buyer to actively think, and under conditions of low involvement and high time pressure, System 2 simply does not activate. The buyer defaults to whatever System 1 makes most accessible.
The implication for campaign strategy: distinctive brand assets should be present, consistently, in every piece of brand communication, regardless of campaign theme or season. The asset should be as recognisable as the product itself. Building a new campaign without featuring the distinctive asset is squandering the memory equity that previous campaigns have built.
The error most marketing teams make is treating the distinctive asset as one creative choice among many. They update the visual identity, change the brand character, evolve the colour system, retire the sonic logo — each change, taken individually, may seem like a reasonable creative decision. Collectively, they erode the one mechanism that makes brand advertising work most efficiently.
It takes millions of dollars and years of advertising and brand exposure to build strong memory structures. This investment should not be thrown away carelessly.
Distinctiveness vs Differentiation
Two words that sound like synonyms and produce opposite strategies.
Differentiation is the older idea. It comes from the positioning tradition — Trout and Ries, Kotler, the mid-century US school. Differentiation asks: what are we, that our competitors are not? What functional or emotional benefit do we uniquely deliver? The strategic move is to identify a defensible product truth and build the brand around it.
Distinctiveness is the newer idea. It comes from the Ehrenberg-Bass tradition — Sharp, Romaniuk, three decades of empirical category research. Distinctiveness asks a different question: when a buyer encounters a fragment of the brand — a colour, a face, a word, a sound — do they immediately recognise it as yours? The strategic move is to build a palette of assets that are ownably yours and use them consistently for long enough that the buyer's brain wires them together.
The two ideas are not incompatible. In practice they are almost never balanced correctly.
Byron Sharp's position, sharpened over a decade of pricing research, is that meaningful differentiation is rare in most consumer categories. When his team ran controlled pricing experiments across brands the researchers considered clearly differentiated — different flavours, pack sizes, formulations, brand personalities — buyers in most cases did not perceive the differentiation and did not shift behaviour in response to it. The one experimental condition that produced a measurable behaviour shift was a product that was organic and gluten-free. Regulatory and dietary claims registered. Most other "differentiation" did not.
Sharp's summary line, from the Cannes Lions stage he shared with Mark Ritson in June 2026: "If you need complicated market research to torture data to find your differentiation, you haven't got any."
Ritson, sharing that stage, agreed on the primacy of distinctiveness but argued for what he called "relative differentiation" — not uniqueness in the strict sense, but a coherent positioning claim layered on top of the asset system. Sharp classified that as positioning rather than differentiation and moved on. The two also converged on terminology: Ritson publicly committed to renaming his MiniMBA "brand codes" modules to "distinctive brand assets," ending a fifteen-year fragmentation of the language — brand codes, fluency, fluid assets, well-branded — that had, in Ritson's phrasing, been "confusing the fuck out of young marketers on this key point."
The practical implication for a CMO is not that differentiation is worthless. It is that most brands claim differentiation they do not have, invest heavily in trying to prove or communicate it, and get no compounding return from that investment. The same budget applied to distinctive asset discipline — using the same colours, the same character, the same slogan, the same sonic signature, campaign after campaign, year after year — produces measurable compounding growth in brand retrieval and purchase probability. Distinctiveness compounds. Differentiation, in most categories, does not.
The question a CMO should ask before signing off any new brand campaign is not "how are we different?" but "does this look like us?" — meaning: is every asset in the piece one the buyer already associates with the brand, or are we resetting the memory work from scratch?
Two data points from the Cannes session make the stakes concrete. TikTok research shared by Ritson: if a video ad does not present four distinctive brand assets in the first two seconds, most of the impact fails. Sharp's supporting figure: in FMCG, 40% of any year's sales come from buyers who did not purchase last year — buyers who are re-encountering the brand cold and need instant recognition to consider it at all. If the brand is not instantly recognisable, it is not considered. If it is not considered, it is not bought. The entire brand economy runs on distinctiveness before it runs on anything else.
Distinctiveness is the harder discipline because it demands the marketing team resist the boredom of using the same assets over and over. It rewards patience. It punishes creative reinvention. It compounds.
The full Ritson–Sharp Cannes exchange, the six categories of distinctive brand asset, and a set of textbook examples the marketing science community treats as reference cases are all covered in the Distinctive Brand Assets companion material.
The Physical Availability Dimension
Mental availability and physical availability are the two dimensions of brand growth, and they interact.
Mental availability without physical availability is wasted awareness. You have built a desire that has nowhere to go. The buyer thinks of you, searches for you, and cannot easily find or purchase you. That lost moment is not neutral — it is actively damaging, because the buyer's next step is to buy a competitor who is physically available.
Physical availability has two distinct dimensions: where you can be bought, and how well you convert once a buyer arrives.
The distribution layer — where you can be bought
For D2C brands, this is the set of channels where the product is accessible: your own online store, Amazon, TikTok Shop, and any other digital platform where buyers search and discover products. For FMCG brands, it is the total range of physical and commercial channels: more retailers, more store formats, vending machines, food service, convenience stores, petrol stations, and potentially own-brand retail. In both cases the strategic question is the same: in how many of the places where your potential buyer is, can they actually find and buy your product?
The relationship between distribution and sales is not linear — it follows a distribution elasticity curve. Early distribution gains, when the brand enters new outlets, deliver the highest return per distribution point. A brand stocked in 20% of outlets faces a full competitive set in most stores. A brand stocked in 70–80% of outlets increasingly appears in smaller-format stores — convenience, specialty, local — where the shelf carries only two or three options instead of twenty. In those contexts the brand that is there wins by default, because the competitive set has effectively been eliminated by distribution depth. Getting to that level is compounding: each new format reduces relative competition and increases purchase probability.
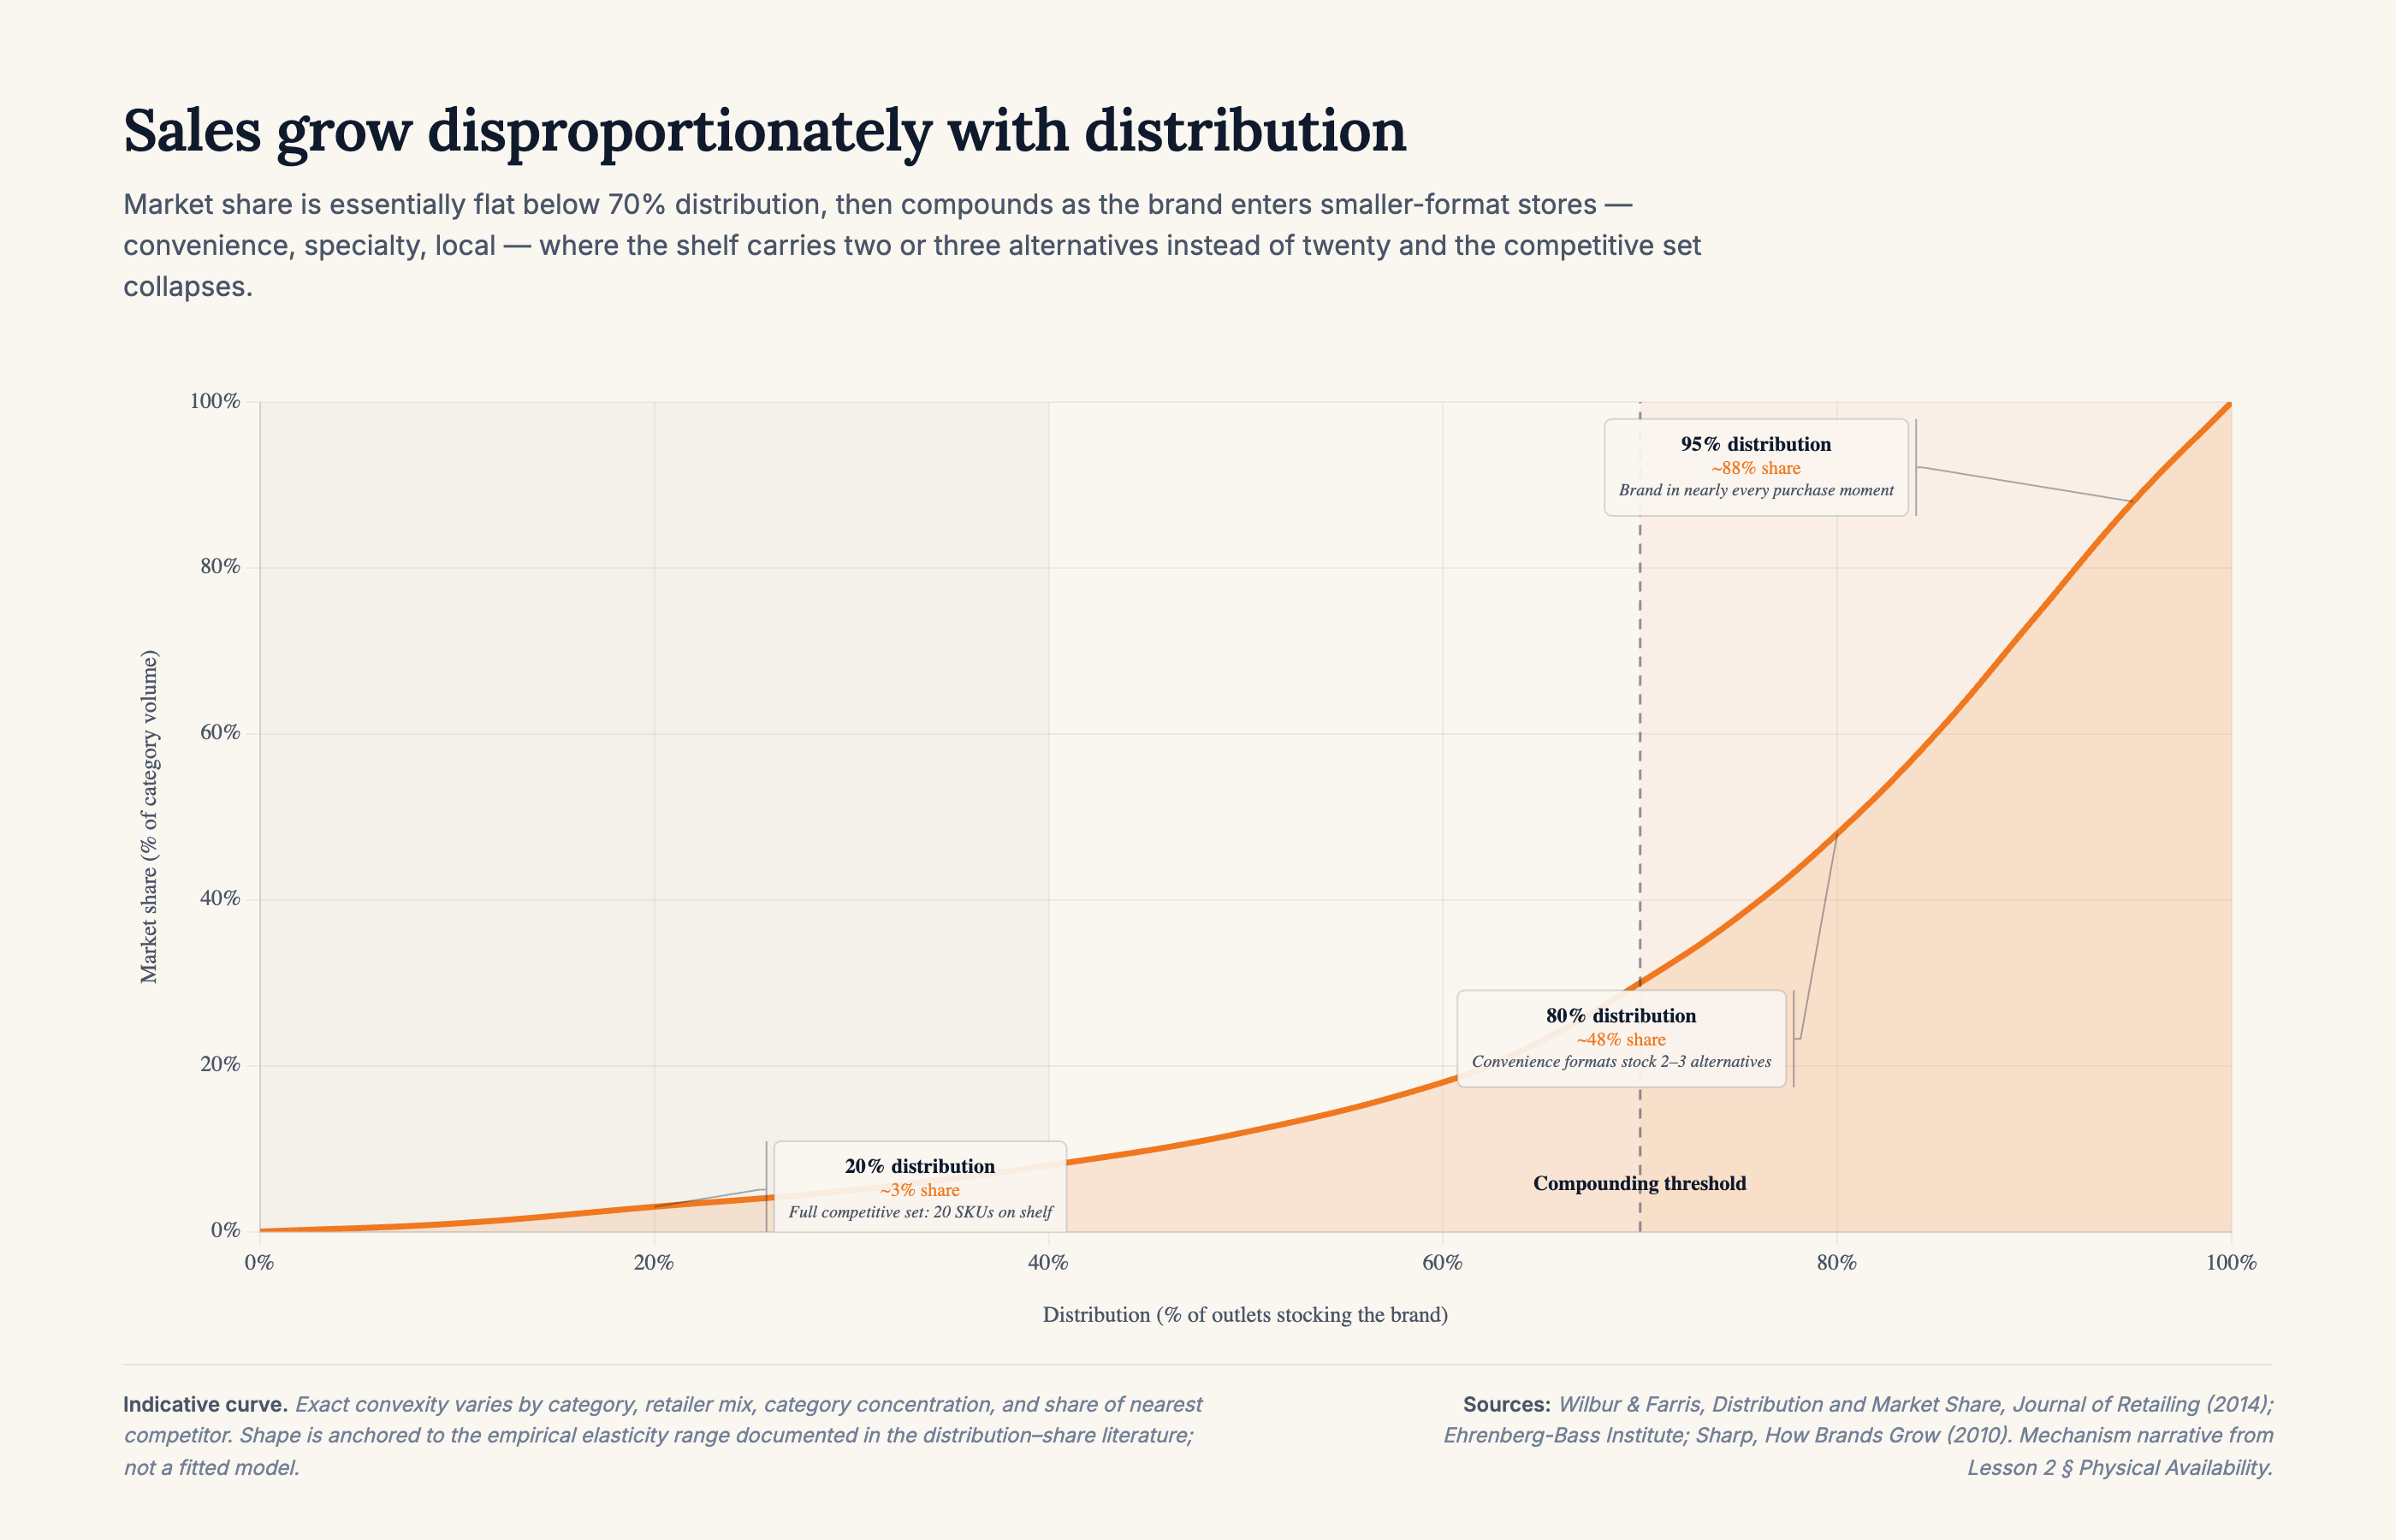
Material: sales-distribution-elasticity.html · Sources: Wilbur & Farris, "Distribution and Market Share," Journal of Retailing (2014); Ehrenberg-Bass Institute; Sharp, How Brands Grow (2010).
The conversion layer — how well you convert at the point of purchase
Once a buyer can find you, conversion depends on the quality of the experience at the point of purchase.
For D2C brands, this is the conversion funnel: how efficiently the online experience moves a visitor from product discovery to completed checkout, checkout friction, payment options, delivery clarity, returns policy. These are standard CRO levers that compound — a 2% improvement in checkout conversion applies to every buyer thereafter.
For FMCG brands, the equivalent is the in-store purchase decision: shelf placement (eye level converts more than floor level), in-store visibility and secondary placements, packaging design that communicates brand value in under two seconds, trade marketing that generates promotional placement, and shopper analytics that reveal where the physical purchase journey breaks down.
Price as a dimension of physical availability
There is a third dimension that rarely gets framed this way: price. If a buyer wants to purchase your product but cannot afford it, the product is not physically available to them — regardless of how widely it is distributed. A pricing offer, a promotional price, a financing option, a bundle, or a subscription model can make a product accessible to a buyer who was previously priced out. This is physical availability engineering through commercial design. The CMO should hold this lever together with the CFO, not leave it entirely to finance.
The CMO who understands the mental/physical availability framework builds both tracks simultaneously. Mental availability campaigns reach the future buyer. Physical availability investment converts them when they arrive.
What This Means for the CMO's Budget Conversation
The 95/5 rule and the Ehrenberg findings have a direct implication for every budget conversation the CMO has.
When the CFO asks why you need to spend money on people who are not buying right now, the answer is not "brand building." That answer produces a conversation about whether brand is a real investment or a nice-to-have.
The framing that works is the one the CFO already uses for every other long-horizon capital decision: portfolio investment logic.
Think of brand investment the way a rational investor thinks about buying shares. When you allocate capital to a company's stock, you believe the business will grow in value over time — but you do not know exactly when the return will materialise, or precisely how large it will be. You invest because the expected future value exceeds the cost of the capital committed today. Nobody asks the investor to prove which specific quarter's earnings their share purchase caused.
Brand investment works the same way. You allocate budget today because the 95% of potential buyers who are not in-market this week will eventually enter the market. When they do, they will choose from the brands they have already encountered and remember. Your job is to be in that memory before the purchase moment arrives. That is a future revenue investment, not a cost.
The mathematical case makes this concrete. If only 5% of your total addressable market is in-market in any given week, why would you allocate 100% of your marketing budget to capturing them? The expected return on that allocation is structurally capped — you can only reach 5% of the available opportunity. The other 95% of potential buyers — tomorrow's revenue — are being left entirely unaddressed.
A more rational allocation treats brand and performance the way a portfolio manager treats growth assets and income assets: diversified by time horizon. Performance spend converts the buyers who are ready now. Brand spend builds the pipeline of buyers who will be ready in six months, a year, or three years. Splitting the budget between the 5% in-market today and the 95% who will enter tomorrow is not idealism. It is better-diversified investment in future revenue — the same logic the CFO applies to every other capital allocation decision in the business.
That framing is the one that lands in the board room. Not because it is soft. Because it is the correct description of what brand marketing does, expressed in the terms the CFO already understands.
Common Mistakes That Flow from Misunderstanding This
Targeting too narrowly. Behavioural and demographic targeting tools make it easy to reach "people who are likely to buy soon." That is a useful tool for performance activation. It is a counterproductive tool for mental availability building, because the people most likely to buy soon are already partially in the funnel. Building mental availability requires reaching the vast pool of people who are not likely to buy soon but will eventually. Narrow targeting starves that pool.
Optimising for engagement instead of reach. Platforms reward engagement metrics — likes, comments, shares, saves. Campaigns optimised for engagement reach the subset of your audience most likely to interact, which is typically your existing followers and heavy buyers. That audience already knows you. Optimising for engagement reaches fewer new minds. Optimising for reach — views, impressions across a broad, unduplicated audience — builds more mental availability per euro.
Confusing retention with penetration. A brand that has built a strong loyalty cohort but is not growing its buyer base is, in the Double Jeopardy framework, a brand that is not growing. The loyal cohort is visible, vocal, and engaging. The growth opportunity is invisible, silent, and indifferent. Marketing resources that flow toward the visible loyal base and away from the invisible potential buyer base are optimising in the wrong direction.
Running too many campaigns, too short. Mental availability is a function of consistent presence over time. Short campaigns — four weeks on, eight weeks dark — build weak memory structures. The associations formed during the campaign decay during the dark period. The most efficient model for mental availability building is consistent presence, at lower weight, sustained over months and years. Many CMOs run more campaigns for shorter periods because that generates more internal activity and more visible output. The right model generates less activity and more impact.
The CMO's Fundamental Tension
Understanding how markets work puts the CMO in a specific and difficult position.
The logic of brand investment — reaching the 95% who are not buying today to build mental availability for the purchase moment that will arrive eventually — is correct. The evidence base for it is robust. The commercial mechanism is clear.
But the organisation's incentive structures are all built around the 5%. Quarterly reporting. Monthly P&L reviews. Campaign performance dashboards. Conversion attribution. All of these systems measure the 5% and ignore the 95%.
The CMO's job is to hold both timescales simultaneously: to deliver results in the short term through effective activation, while protecting the investment in the 95% that determines the long-term trajectory of the brand. That tension never fully resolves. It is part of the role.
The CMO who understands it — who can walk into a board meeting and explain why a campaign that reached three million people who did not buy anything this quarter was a productive investment — is operating at the level the role requires. The CMO who cannot make that argument, or who abandons the long-term investment under short-term pressure, is not yet operating at that level.
How markets work is the foundation of everything else in this course. The budget decisions, the channel choices, the brand investment argument, the investor story — all of it rests on this understanding. If you know that the 95% are the primary growth opportunity, and that mental availability is how you access them, the rest of the strategic logic follows.